Differences between V 1.2.0 and 1.1.3
Lepton fluxes
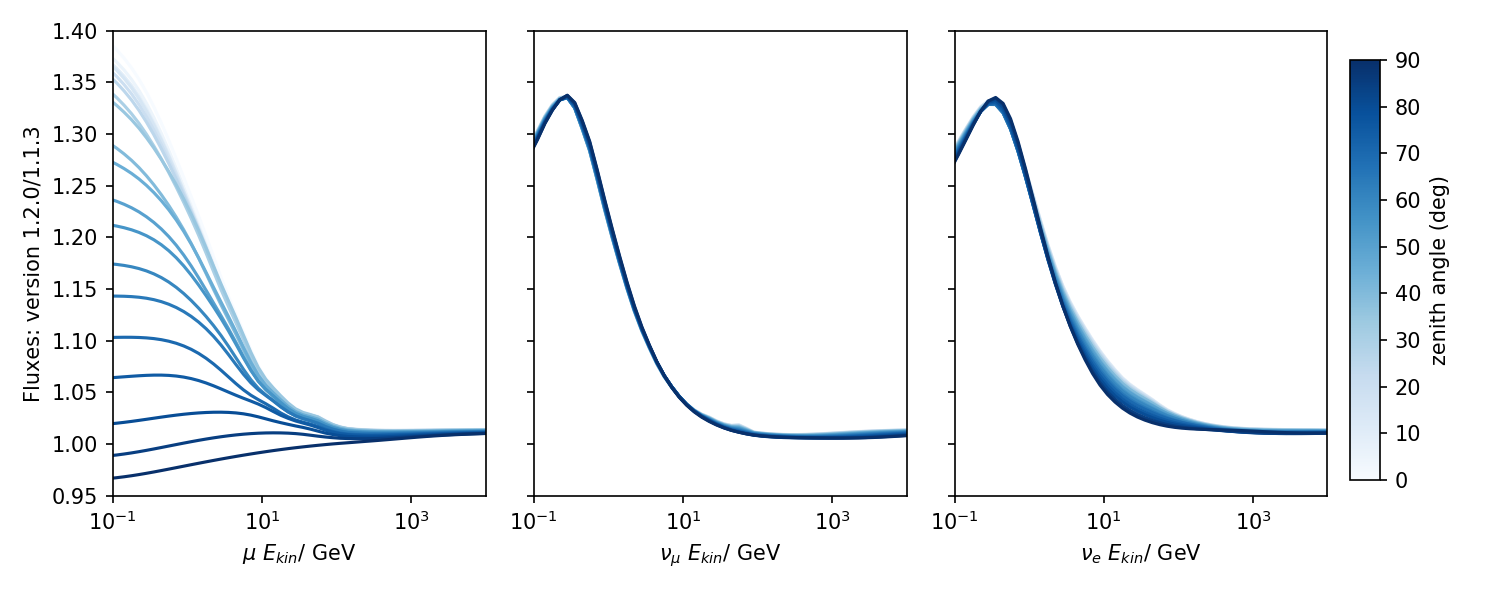
Ratio of fluxes generated with the H3a primary model and EPOS-LHC between the versions 1.2.0 and 1.1.3 (from left to right for muons, muon neutrinos and electron neutrinos). Shades are used for different zenith angles.
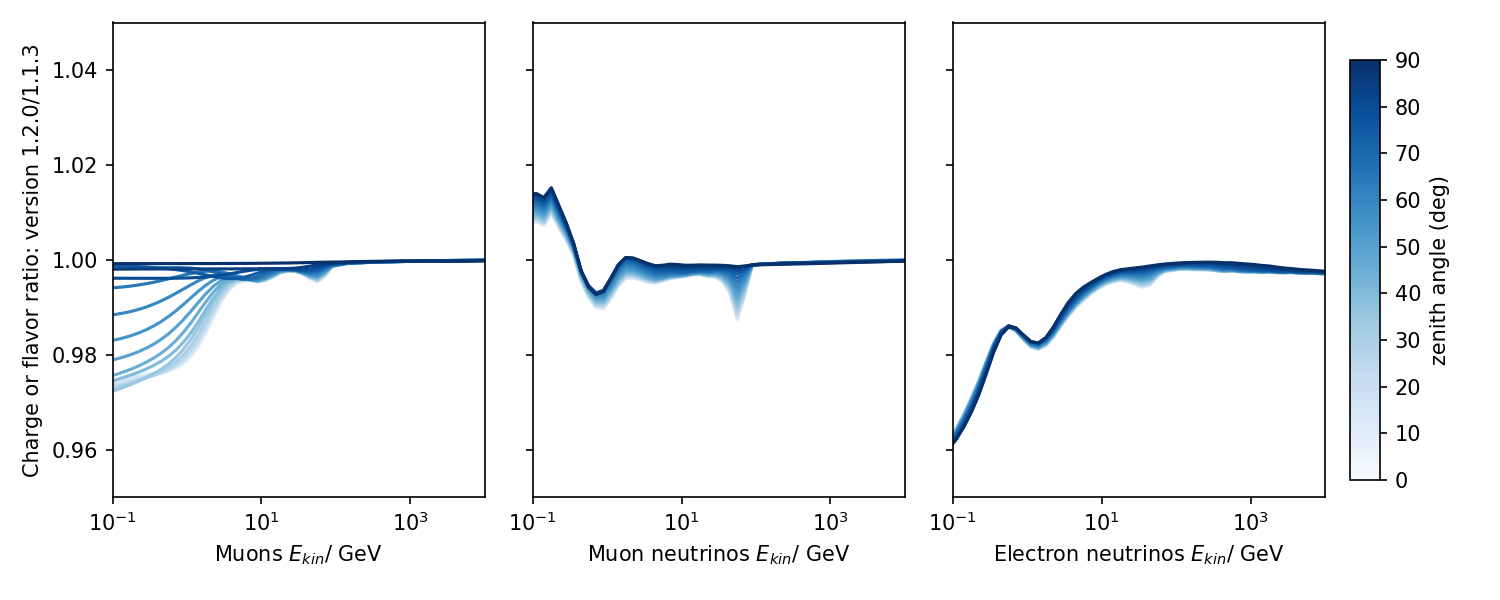
Ratio of muon charge ratio (left) and neutrino/anti-neutrino ratios (center and right) generated with the H3a primary model and EPOS-LHC between the versions 1.2.0 and 1.1.3. Shades are used for different zenith angles. Note that the scale is different compared to the upper plot.
The origin of this changes is a bug in the scripts used for the generation of the decay tables. The bug was a “wrong” formula for the boost discovered by Matthias Huber, thx. The effect is strongest at low energies as seen in the plots. At high energies there are no changes. For fluxes the changes are most striking in the zenith distribution of muons. For neutrinos the effect is mostly related to the spectral index. For electron neutrinos there is some effect for the zenith distribution at tens of GeV and will affect predictions made for IceCube DeepCore or KM3Net-ORCA. Update and recomputation of expectations is therefore recommended. For high energies, i.e. IceCube/P-ONE/ARCA recomputation is not necessary.
Muons in air showers
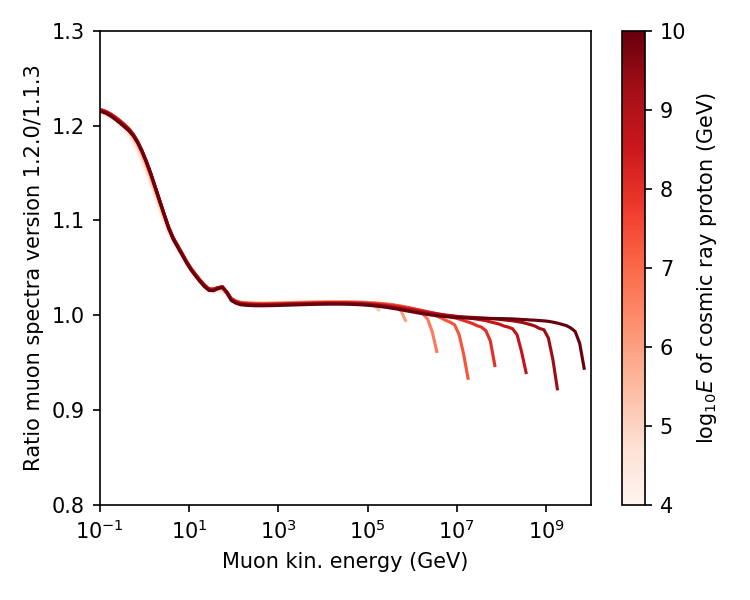
Ratio of muon spectra for single primaries generated with EPOS-LHC between the versions 1.2.0 and 1.1.3 for vertical zenith angle. Shades are used for different primary energies.
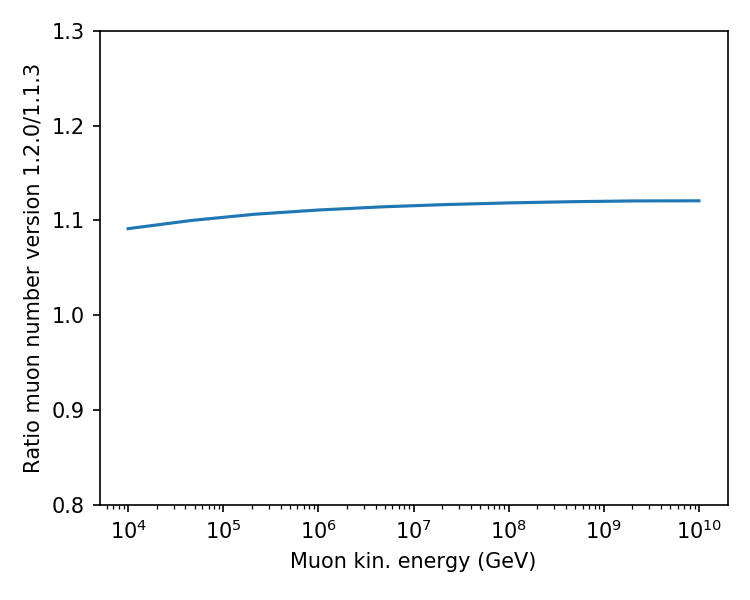
Ratio of the number of muons with energies > 100 MeV at the surface, also for EPOS-LHC and vertical zenith.
For MCEq computations for a single primary, the resulting spectra constitute the spectrum of particles in air showers. There is a ~10% change for the muon number.
Other changes
Some particle “mappings” have been updated and synchronized between the development version of CORSIKA 8. This has minor impact on the hadron ratios within the cascade and can lead to percent/sub-percent changes here and there.
Acknowledgements
The author is grateful to Matthias Huber (TUM) for helping with the discovery of the “decay bug”. And to Maximilian Reininghaus and Ralf Ulrich (KIT) for making thorough and very detailed cross checks with various versions of CORSIKA.